Executive Summary
In this document, we present the value of using a model-based mass-balance approach for tracking the fate of plastic packaging waste across different countries, packaging types, and polymers. This is the approach EA uses to produce the ‘Plasteax’ database.
The need for data about waste and its management is dictated by the urgency of reducing plastic pollution, in particular stemming from packaging, which is one of the largest challenges we face in the world today.
The sheer scope of data granularity required to make meaningful decisions in the face of this problem makes a pure primary data collection approach practically unfeasible.
Our approach combines reliable, publicly available, primary data, with upstream data and system knowledge to create a holistic model that produces secondary data for continuous improvement.
We at Earth Action believe that with this approach we can provide data of a sufficient quality for businesses, governments, and civil society to act with confidence, meet their ambitious commitments, and take actions that are grounded in data.
Introduction
Plastic consumption and waste management is among the most pressing and complex environmental challenges the world faces. Addressing these challenges requires reliable and actionable data.
However, obtaining, processing, and managing such data – especially at the level of granularity needed for governmental and corporate strategies – is no small task.
What if there was an alternative to spending tens of thousands of euros on unvetted data, putting in hundreds of hours combing through multiple datasets, and talking to in-country waste management experts to still get potentially fallible results?
This document introduces the high-level principles used in the mathematical model underlying Plasteax, Earth Action’s answer to the demand for plastic packaging waste management data.
More specific information about sources, calculations, and steps is available at docs.plasteax.earth.
By outlining our approach and discussing other methods, we aim to illustrate the value of the Plasteax model in providing reliable insights for decision-makers in both the public and private sectors.
The problem
Plastic pollution is considered one of the ten greatest challenges for the 21st century. Since 1950, annual global plastic production has surged from 1.5 to 460 million metric tonnes in 2019, and it is estimated that in 2020, 52.1 million tonnes of plastic waste was emitted into unmanaged systems.
There is an urgent need for comprehensive and immediate action to tackle this problem.
Given the global scale of the problem, removing plastics from the environment is not feasible. In fact, the process of removing plastics from the environment is not harmless in and of itself and may cause additional damage to nature and ecosystems.
An approach that simply cures the symptoms is not sustainable. Prevention and reduction strategies should be the priority.
While it is crucial to scale back the production of plastics, (we can no longer afford not to), many essential industries rely heavily on plastic and would not function without continued production.
So, in order to effectively reduce the pollution stemming from plastic materials, we need to track and understand what happens to plastic post-consumer – when it becomes waste.
This is very difficult. Globally, plastic production, trade, and waste management systems vary considerably, and none completely account for every piece of plastic or packaging.
Despite this, companies are being required to report on and disclose what happens to their packaging post-consumer, and countries are being asked to put in place policies and practices/infrastructure to reduce their total volume of plastic pollution.
To ensure the right actions are taken for both companies and governments, data is needed. Data that is currently unavailable and is highly unlikely to become available soon.
Ideal vs real world
In an ideal world, collecting this data would be straightforward and each data point would be verifiable. Every data point — covering the fate of all plastic waste across categories and polymers — would be available as primary data, sourced from reliable and mutually consistent providers.
Governments and national organisations would take on the task of measuring what waste makes it into which waste management system, and it would be a simple case of collecting, compiling, and presenting this information.
The work we do on Plasteax would be unnecessary.
Unfortunately, this is not the case. Existing data is often incomplete, inconsistent, or simply unavailable for many regions and categories. Even where data does exist, it is fragmented across sources that employ differing methodologies and levels of granularity, making direct comparison impossible.
How to solve the problem
Given that the data we’re talking about cannot be perfect – information about what happens to plastic packaging post-consumer is impossible to obtain without tracking each piece of plastic individually. Therefore, we need to determine what is ‘good-enough’.
What exactly ‘good enough’ means is very subjective, and to date there is no set science-based target for plastic pollution. Instead, we’re asking ‘what level of data granularity is enough for governments and companies to start to confidently make decisions to reduce their impact’.
For the sake of this article, we’ll use the guidelines already established by the Ellen MacArthur foundation’s global commitment, and the UN environment programme (UNEP) new plastics economy global commitment as a starting point.
EMF Global Commitment requirements
For each of the listed packaging categories (appendix A), businesses and governments need data on the following in order to be able to set and adhere to commitments :
- When packaging can be considered reusable, recyclable, or compostable in practice and at scale in the different markets in which they operate.
- How much of their plastic packaging is collected and recycled/composted and how much is landfilled, incinerated, or mismanaged.
- What the reuse, recycling, and composting rates are for specific areas.
- How much plastic that is problematic or unnecessary is produced, traded, used, and becomes waste in a given country.
These requirements are paraphrased for simplicity and there are more requirements in the global commitment, but the others should be available to individual businesses without the need for an external database.

Good enough data
Thus, for data to be considered ‘good enough’ to meet the global commitment and thus to make strategic decisions, each product ‘only’ needs to be broken down to determine data that matches the following simple schema:
| Product packaging: Example Earth Action fictional plastic water bottle | ||||||
| Country: Netherlands | ||||||
| Reusable? | Recyclable? | Problematic? | % collected | % recycled | % mismanaged | |
| PET bottle | Y | Y | N | 10 | 70 | 20 |
| mono material LDPE in B2C | N | Y | N | 20 | 10 | 70 |
This data can be retrieved or derived from national? policies, waste management infrastructure documentation, and waste management data.
However, it is easy to see that for a company operating in several countries, with several products, made up of several materials, finding this data is hard work.
The way we see it there are two approaches:
Data collection approach
This is a ‘bottom up’ method that means collecting primary data. The idea is to start with the final ‘downstream’ information collected from facilities such as landfills or recycling centres and then build up to total volumes.
For example, to determine how much PET is recycled in the Netherlands in 2023, you would:
- Survey all recycling facilities in the Netherlands to collect data on PET processed
- Add up their individual volumes to get total recycled PET
- Do similar surveys for landfills, incinerators etc. to track other waste streams
- Compile and standardize all this primary data into total volumes
This approach matches what we discussed before: in an ideal world, this process would be very straightforward – in reality, it is quite difficult due to a lack of data collection, a lack of harmonized definitions, insufficient formal infrastructure, and other issues.
Advantages:
- The database is derived directly from real-world measurement of primary data, i.e. real data (besides the uncertainty/reliability of sources) and is thereby unrefutably accurate.
Disadvantages:
- The resulting database is incomplete by virtue of the collection approach. It would cover only a fraction of the desired granular data and would have to extrapolate the rest, calling into question the accuracy of extrapolation anyway.
- To improve or update the database with new information the same large amount of work needs to be carried out on a regular basis.
- Combining data from disparate sources often leads to consistency issues due to methodological variations, differing country-specific datasets, and general lack of homogeneity.
Model-based approach
The alternative approach would be to ‘model’ the data. A good model for this matter combines both a top-down and bottom-up approach. Such a method significantly reduces the need for primary data by integrating mathematical assumptions with existing reliable data to generate accurate secondary data – reliable estimations of the truth.
Using the same examples as before, to estimate PET recycling in the Netherlands in 2023, you would:
- Start with total PET consumption data from a reliable source in the Netherlands
- Apply known recycling rates from government reports or industry data
- Cross-validate with recycling facility capacity data
- Compare results against independent benchmarks like Eurostat
This yields a reliable estimate while requiring significantly less primary data collection. A model’s key advantage is its adaptability – as new research is completed or calculation errors are identified, assumptions can be updated and the model recalibrated, allowing for the simple and continuous improvement of the data.
Advantages
- Ensures consistency and homogeneity across datasets, allowing the database to provide comparable information for all countries and levels of granularity.
- Allows for data to be added and improved over time as more primary data becomes available.
Disadvantages:
- The database consists of secondary data, which introduces a degree of uncertainty. This uncertainty stems from model assumptions and the transformation of primary data.
- It is impossible to gauge the precise accuracy of the model without empirical data or on the ground measurement of what we are trying to model, and in many cases the reason we are doing the modelling is precisely because this data does not exist.
Plasteax’s approach
We believe that to provide data that is ‘good enough’, taking a ‘model-based approach’ is best. This way more time can be spent searching for the best available data in industry and literature, comparing it to the model’s results, and continuously improving the output.
At its core, the Plasteax model follows a mass balance, top-down approach (more details below), using established totals of plastic production and trade as constraints.
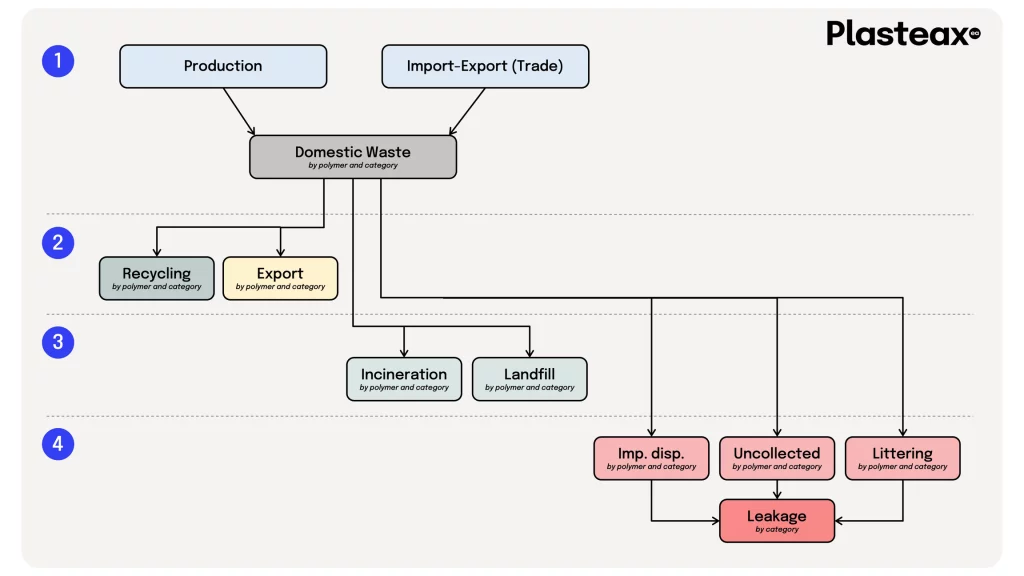
These known quantities serve as checkpoints for us to validate our estimates and ensure consistency across the model, coupled with bottom-up, primary data about waste management systems, that allow us to be confident in the reliability of our data.
A mass balance approach is a method of accounting that ensures the total input and output of a system are consistent. By enforcing this, the model maintains physical plausibility across datasets, while outliers can be easily identified and investigated.
The value of a mass balance approach lies in:
What is a mass balance approach?
- Error containment: In Plasteax estimations, the total volume of plastic consumption and waste generation for a country is a fixed constraint. This means errors can only affect how plastic is distributed among different categories and fates, not the total amounts – preventing over or underestimation.
- Validation and reliability: The physical constraints of mass balance provide a built-in validation system. When numbers don’t add up, or calculations are erroneous, this immediately signals potential data quality issues or modeling errors that need investigation.
- Scalability: Mass balance enables the model to adapt as more primary data becomes available, progressively refining its estimates while maintaining the integrity of the overarching constraints.
The mass balance approach underpins Plasteax’s ability to generate consistent, accurate, and actionable data for decision-making at both granular and aggregate levels.
Applying a mass balance approach in Plasteax
In Plasteax we constrain our model on two levels:
On a global level
We use production and trade (import/export) data flows to determine plastic volumes globally. We do this so that no calculations exceed the total amount of plastic that exists in all the countries each year.
On a country level
We combine this information with consumption and waste generation data for individual countries to validate and constrain these volumes further and reconcile any discrepancies between trade flows and domestic data.
Consistency of different sources
Relying on multiple sources is generally not advisable due to the lack of mutual consistency. This can be attributed to various factors – different methodologies for measuring data, varying taxonomies and definitions, and or differing reporting standards.
A system that relies on multiple sources, such as a pure bottom-up data collection approach, may introduce inaccuracies simply due to the incompatibility of its sources.
The Plasteax model addresses this through two key strategies. First, it primarily relies on a limited set of carefully selected sources for its input data around production and trade.
Second, it employs a rigorous data transformation/mapping process that normalizes all incoming data into a standardized structure, ensuring consistency across different sources.
Additional country-specific data points – which include incineration, landfill, and improper disposal rates – are taken from local or regional sources, such as national institutes of statistics, Eurostat (for EU countries), or scientific publications.
These undergo the same transformation process to consolidate taxonomy differences and maintain data consistency.
Such data points are not expected to introduce large errors because they are used as percentages, and do not affect volumes of plastic but only the distribution of those among the different fates – in other words, they do not break the mass balance.
Model validation and improvement
The Plasteax model’s accuracy is continuously validated against independent data sources and real-world benchmarks. When discrepancies are identified, they drive improvements to our assumptions and methodologies.
This iterative process, combined with our standardised data transformation approach, ensures the model becomes more refined over time.
Industry feedback and new research findings are also systematically incorporated, when users find new research or highlight potential errors in the data it allows us to enhance both the model’s accuracy and its practical utility for decision-makers.
The mass balance constraints provide a framework for validating these improvements using automated systems, ensuring changes remain physically plausible.
Summary
We’ve discussed the challenges of tracking plastic waste and the pros and cons of a model-based approach, as opposed to a brute-force data collection scheme.
Given the lack of data availability and compatibility among sources, EA’s answer is a model-based approach, as the most effective and feasible solution to provide both private and public organizations with the data they need to take informed decisions.
Following such an approach, Plasteax combines primary data on plastic production and trade with reasonable assumptions driven by state-of-the-art knowledge in the field. The resulting database provides accurate and actionable data for decision-making at both granular and aggregate levels.
Finally, the nature of this approach favours a continuous development of the methodology which allows for a systematic improvement of the accuracy of the database.
Appendix 1: EMF GC packaging categories
| Packaging category | Example | |
| Rigid / 3D | PET bottle – beverage | Bottles of water, carbonated drinks, … |
| PET bottle – food | Bottles of cooking oils, sauces, … | |
| PET bottle – other | Bottles of detergents, cosmetics, … | |
| PET thermoforms | Trays, cups, blisters, … | |
| Other PET rigid | Jars, … | |
| HDPE bottle – beverage | Milk bottles, … | |
| HDPE bottle – food | Bottles for yogurts, jelly, … | |
| HDPE bottle – other | ||
| HDPE other rigid | Pots, tubs, trays, cups, jars, … | |
| PP bottle | ||
| PP other rigid | Pots, tubs, trays, cups, jars, … | |
| LDPE tubes | ||
| PS rigid | Pots, trays, … | |
| EPS rigid | Clamshells, … | |
| PVC rigid | Blisters, bottles, trays, … | |
| PC bottles in B2B | Large (refillable) water jugs in office buildings | |
| PC rigid in B2C | ||
| Other rigid | Multimaterial, PLA, PEF, PU, ABS, SAN, PET-G, PA, PET-Cellophane, … | |
| Flexible / 2D | >A4 mono material LDPE in B2B | Pallet wraps, large LDPE bags, … |
| >A4 mono material LDPE in B2C | Wrap around bottles, wrap around toilet paper, … | |
| Other >A4 flexibles | ||
| <A4 flexibles, LDPE | Pouches, sachets, wrappers, small bags, … | |
| <A4 flexibles, PP | Pouches, sachets, wrappers, small bags, … | |
| <A4 flexibles, multimaterial | Pouches, sachets, wrappers, small bags, … |
Appendix 2: EMF GC breakdown
The following breakdown is a summary and paraphrasing of the EMF global commitment document, nothing new:
According to the Global Commitment, when relevant, businesses must (and there for find data to) commit to the following:
- Take action to eliminate problematic or unnecessary plastic packaging
- Take action to move from single use towards reuse models where relevant
- 100% of plastic packaging to be reusable, recyclable, or compostable
- Set an ambitious recycled content target across all plastic packaging used
- Set an ambitious target to increase the use of recycled plastics
- Raw material producers – compostable plastics: set a target to increase the share of renewable content to at least 75% from responsibly managed sources
- Collection, sorting, and recycling industry: Set an ambitious target to grow the volume and quality of recycled/composted plastics, and accordingly increase the ratio of recycled and composted over landfilled and incinerated plastic volumes
- Durable goods producers: Set an ambitious recycled content target across all plastics used in products or components
- Suppliers to the plastics industry: Make an ambitious set of commitments that support the businesses in the plastics industry to achieve their commitments
- Investors: Invest a meaningful amount in businesses, technologies, or other assets that work to realise the vision of a circular economy for plastics
- Commit to collaborate towards increasing reuse/recycling/composting rates for plastics
- Report annually and publicly on progress as well as on annual volumes (tonnes) of plastics production/use
And governments must (and therefore need data to)
- Commit to have ambitious policies and measurable targets in place well ahead of 2025 in order to realise and report tangible progress in each of the following five areas:
- Stimulating the elimination of problematic or unnecessary plastic packaging and/or products
- Encouraging reuse models where relevant, to reduce the need for single-use plastic packaging and/or products
- Incentivising the use of reusable, recyclable, or compostable plastic packaging
- Increasing collection, sorting, reuse, and recycling rates, and facilitating the establishment of the necessary infrastructure and related funding mechanisms
- Stimulating the demand for recycled plastics
- Commit to collaborate with the private sector and NGOs towards achieving the Global Commitment’s common vision (e.g. through Plastics Pacts)
Global commitment requirements for businesses
Polymer type requirements:
- Report on the specific types of polymers used in plastic packaging (e.g., PET, HDPE, LDPE, PP, PS, etc.).
- Intention: To identify which polymers are recyclable or problematic and assess their end-of-life processing.
Packaging type requirements:
- Categorize plastic packaging by type (e.g., rigid, flexible, multi-material laminates).
- Indicate the intended use, such as primary (consumer-facing), secondary (grouping), or tertiary (transport) packaging.
- Intention: To assess packaging design and its suitability for recycling or reuse.
Recycled content requirements:
- Specify the percentage and total weight of recycled content used in plastic packaging.
- Distinguish between post-consumer recycled (PCR) content and other types of recycled materials.
- Intention: To track progress towards reducing reliance on virgin plastics and increasing the use of recycled materials.
Waste management outcomes:
- Requirements: Provide data on the end-of-life fate of all plastic packaging:
- Recycling: Amount and percentage recycled.
- Landfilling: Amount and percentage sent to landfill.
- Energy Recovery: Amount and percentage incinerated for energy.
- Leakage: Estimate of plastic that has leaked into the environment.
- Intention: To enable tracking of how effectively plastics are managed after use.
Geographic data requirements:
- Report on waste management practices and outcomes by geographic region.
- Highlight differences in recycling infrastructure and capacities.
- Intention: Identifies regions with limited capacity for recycling or other waste management processes.
Problematic and unnecessary plastics requirements:
- Report efforts to phase out specific problematic materials (e.g., PVC, polystyrene, oxo-degradable plastics).
- Provide details on the progress of eliminating unnecessary single-use packaging.
- Intention: Aligns with the commitment to reduce waste at the source.
Recycling rate requirements:
- Report on the percentage of plastic packaging that is:
- Recyclable in practice (considering local infrastructure).
- Recyclable in principle (theoretically recyclable, but not currently supported by infrastructure).
- Intention: Assesses the actual recyclability of materials.
Reuse model requirements:
- Detail the proportion of packaging designed for reuse.
- Report the number of reuse systems implemented and their effectiveness (e.g., return rates).
- Intention: To encourage a shift towards circular economy models.
Innovations and alternatives requirements:
- Provide updates on innovative solutions adopted to replace traditional plastics.
- Report on trials or launches of alternative materials or reusable packaging systems.
- Intention: To track innovation to move away from single-use plastics.
Targets and progress metrics requirements:
- Set clear targets for reducing plastic usage and increasing recycling/reuse.
- Provide year-on-year progress data against these targets.
- Intention: To ensure accountability and drives continuous improvement.
Supply chain data requirements:
- Map supply chains to identify where plastics are sourced, used, and disposed of.
- Intention: To enhance understanding of plastic flows and hotspots for intervention.
Global commitment requirements for governments
- Policies Implemented: Governments must report on policies introduced to promote waste reduction, recycling, and reuse.
- Infrastructure Investments: Detail funding or initiatives to expand waste management and recycling capabilities.
- Measurable Outcomes: Provide quantitative data on reductions in plastic waste and improvements in recycling rates.
In this list of requirements there are two kinds of metrics:
- ‘Internal metrics’: things that the entities themselves should have or measure.
- Problematic and Unnecessary Plastics, supply chain data, reuse models, and innovations and alternatives for businesses
- Infrastructure investments and policies implemented for governments
- ‘External metrics’: things that are external to the entities and so need to be measured at least in part using external systems:
- Most of the metrics for businesses
- Measurable outcomes for governments